
Use Python to Automate the PowerPoint Update
Step by step tutorial to edit PowerPoint slides using Python
Goal
After the two articles about using Microsoft Excel smarter, I have received a few direct messages saying that they are interested in this area and hope I could share more on other office products. It stimulates me to make a collection series of articles related to office tips. And the first one is Microsoft PowerPoint. In this article, you would learn about
- how to determine the shapes in the PowerPoint slides.
- modifying the slide such as inserting images or changing words.
- the methods to output the slides in different formats such as PNG or PDF.
Also, if you have not yet checked my articles about Microsoft Excel, feel free to check the links below.
Background
In many people daily work, they have to frequently and regularly update the figures in the PowerPoint slides such as the table figures, date, KPI statistics, etc. It would be quite annoying to spend 15–30 minutes every day just to handle these kinds of tedious works.
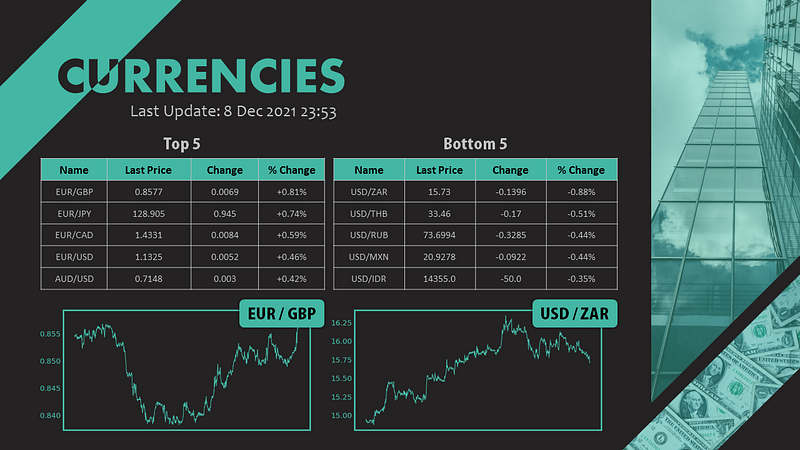
In the following example, we are assuming to have a regular update on the currency exchange prices to pop up the currency exchange rates that are having the largest changes and we are required to show the trending of the prices for the one with the largest percentage changes.
All codes and materials are uploaded to my GitHub. You can check and folk this repo to further study. =)
Step 1 — Define the Corresponding Components
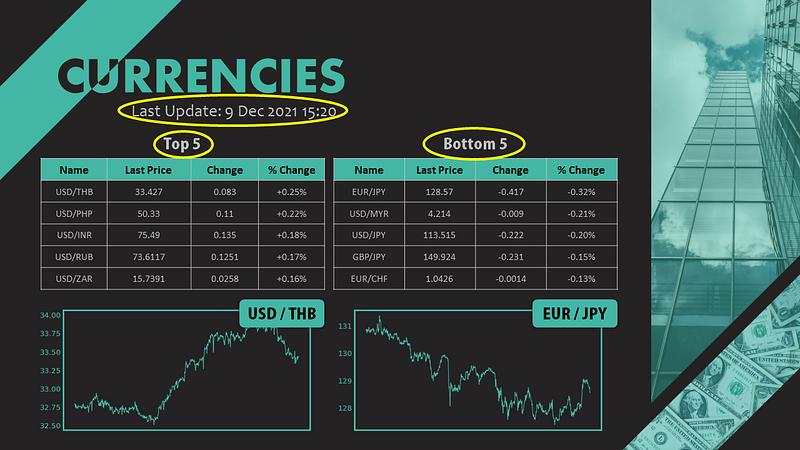
First things first, we have to decide the elements that we are going to update. Take my slide as an example, there are in total 7 places needed to update.
- Last update date time
- Top 5 table
- Bottom 5 table
- Top figure label
- Bottom figure label
- Top figure
- Bottom figure

Step 2 — Data Preparation
After understanding the components to update, what’s next would be the data source to be used for updating. In general office work, the data can be extracted from the SQL server or received the data file from the email, or etc. Here, we would demonstrate the case that the data are scraped from the Internet. We will use the Yahoo Finance data as an illustration.
https://finance.yahoo.com/currencies
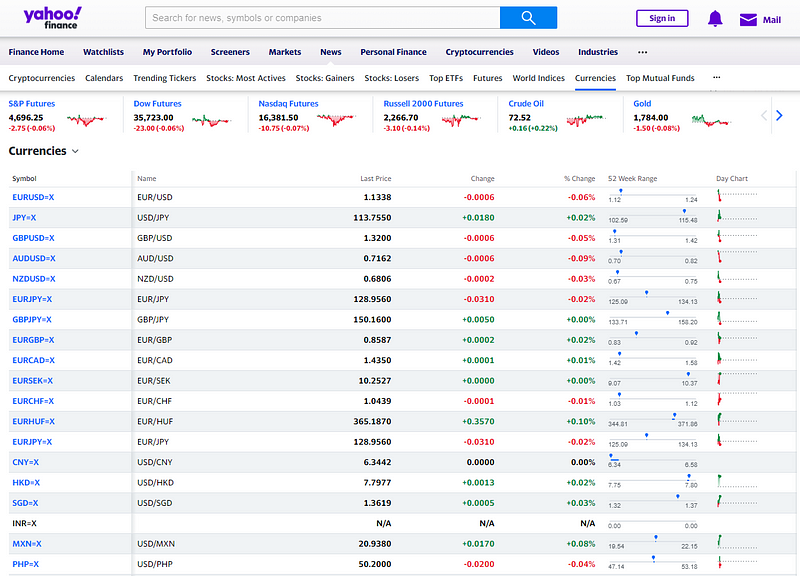
I am not going too deep about how data are scraped since this is not the main focus of this article. Basically, it’s just two lines of code. First, we get the page using requests. Then, we extract the table using pandas. Please note that we have also recorded the scraping date-time for later usage.
import requests
import pandas as pd
from datetime import datetime
datetime_now = datetime.now()
full_list_url='https://finance.yahoo.com/currencies'
full_list_page = requests.get(full_list_url)
df = pd.read_html(full_list_page.text)[0].drop_duplicates()
df['pct_change'] = df['% Change'].str.slice(stop=-1).astype(float)
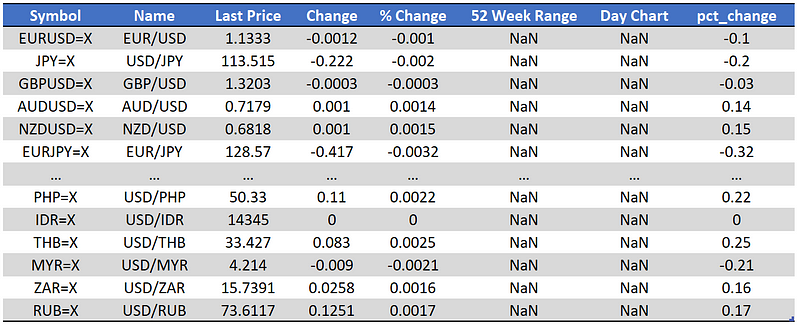
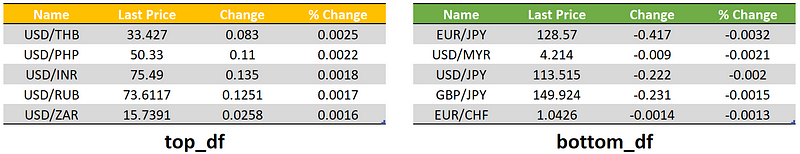
The table looks good and consists of everything we needed. We can now go to the next move which is to sort the tables and get the top 5 and bottom 5 currencies exchange rates.
top_df = df.sort_values(['pct_change'], ascending=False).reset_index(drop=True)[:5]
top_df = top_df[['Name', 'Last Price', 'Change', '% Change']]
bottom_df = df.sort_values(['pct_change'], ascending=True).reset_index(drop=True)[:5]
bottom_df = bottom_df[['Name', 'Last Price', 'Change', '% Change']]
The figures are all ready. The only things left would be the two plots. To generate the plot, you only need to follow the below codes. Don’t worry! I will explain step-by-step and it would be pretty easy to follow.
- Get the data for the currencies exchange rate.
- Extract the closing pricing and plot in a line chart.
- Format the plots such as colouring, font size or transparent background so as to align with the PPT theme.
- Save the plots into PNG.
import json
import matplotlib.pyplot as plt
top_name = top_df['Name'][0].replace('/', '')
bottom_name = bottom_df['Name'][0].replace('/', '')
for idx in range(2):
name = [top_name, bottom_name][idx]
file_path = ['top.png', 'bottom.png']
url = 'https://query1.finance.yahoo.com/v8/finance/chart/' + name + '=X?region=US&lang=en-US&includePrePost=false&interval=30m&useYfid=true&range=1mo&corsDomain=finance.yahoo.com&.tsrc=finance'
header = {'User-Agent': 'Mozilla/5.0 (Macintosh; Intel Mac OS X 10_11_5) AppleWebKit/537.36 (KHTML, like Gecko) Chrome/50.0.2661.102 Safari/537.36'}
page = requests.get(url, headers=header)
temp_json = json.loads(page.text)
price_list = temp_json['chart']['result'][0]['indicators']['quote'][0]['close']
price_list = [price for price in price_list if price != None]
fig, ax = plt.subplots(figsize=(12, 6))
ax.plot(price_list, color='#43B7A4')
ax.set_xticks([])
ax.tick_params(axis='y', colors='#43B7A4', labelsize=20)
for axis in ['top','bottom','left','right']:
    ax.spines[axis].set_color('#43B7A4')
    ax.spines[axis].set_linewidth(4)
plt.savefig(file_path[idx], transparent=True)
1. Get the data
The price series of data for a particular currency exchange rate can be found in the following link. There is only one parameter which is the name of that currency exchange rate.
url = 'https://query1.finance.yahoo.com/v8/finance/chart/' + name + '=X?region=US&lang=en-US&includePrePost=false&interval=30m&useYfid=true&range=1mo&corsDomain=finance.yahoo.com&.tsrc=finance'
Please note that this time you need to specify a header so as to successfully get the page data. The header is used to pretend you are visiting the page through a browser.
header = {'User-Agent': 'Mozilla/5.0 (Macintosh; Intel Mac OS X 10_11_5) AppleWebKit/537.36 (KHTML, like Gecko) Chrome/50.0.2661.102 Safari/537.36'}The rest should be easy to understand which is the common procedure to get the page data and load as JSON format.
page = requests.get(url, headers=header)
temp_json = json.loads(page.text)
2. Plot the line chart
To get the price list, we just have to check the dictionary structure of the data and you can get it. Just one thing to remind is that I have a checking here to remove those None data in the price list since I found there are some missing data in the list.
price_list = temp_json['chart']['result'][0]['indicators']['quote'][0]['close']
price_list = [price for price in price_list if price != None]
We use matplotlib to plot the line.
fig, ax = plt.subplots(figsize=(12, 6))
ax.plot(price_list, color='#43B7A4')
3. Stylize the chart
There are a few things I have made to polish the plots.
- Remove the x-axis ticks for the Date
ax.set_xticks([])
- Change the font size and font color for the y-axis ticks
ax.tick_params(axis='y', colors='#43B7A4', labelsize=20)
- Change the border color and make the line width larger
for axis in ['top','bottom','left','right']:
ax.spines[axis].set_color('#43B7A4')
ax.spines[axis].set_linewidth(4)
4. Save the plot
Finally, we save the figure into PNG format. Please note that to make the background transparent, you only have to specify transparent=True.
plt.savefig(file_path[idx], transparent=True)

Step 3— PowerPoint Update
It comes to our focus today. Before using Python to edit PowerPoint, you need to have the python-pptx package. To install it, you can type the following code in the terminal.
pip install python-pptx
Just follow our usual practice, I show you all the codes first and then I walk you through them step-by-step.
from pptx import Presentation
from pptx.util import Inches
import win32com.client
import os
currencies_ppt = Presentation('Currencies.pptx')
slide = currencies_ppt.slides[0]
shapes = slide.shapes
for shape in shapes:
if shape.shape_type == 13:
shapes.element.remove(shape.element)
top_img_path = 'top.png'
bottom_img_path = 'bottom.png'
top_pic = slide.shapes.add_picture(top_img_path, Inches(0.40), Inches(4.85), width=Inches(5.30))
bottom_pic = slide.shapes.add_picture(bottom_img_path, Inches(5.25), Inches(4.85), width=Inches(5.30))
ref_element = slide.shapes[0]._element
ref_element.addprevious(top_pic._element)
ref_element.addprevious(bottom_pic._element)
shapes = slide.shapes
text_box_list = []
auto_shape_list = []
table_list = []
for shape_idx in range(len(shapes)):
    shape = shapes[shape_idx]
    if shape.shape_type == 17:
        text_box_list.append(shape_idx)
    if shape.shape_type == 1:
        auto_shape_list.append(shape_idx)
    if shape.shape_type == 19:
        table_list.append(shape_idx)
last_update_date_textbox_height = max([shapes[shape_idx].height for shape_idx in text_box_list])
last_update_date_idx = [shape_idx for shape_idx in text_box_list if shapes[shape_idx].height == last_update_date_textbox_height][0]
top_label_left = min([shapes[shape_idx].left for shape_idx in auto_shape_list])
top_label_idx = [shape_idx for shape_idx in auto_shape_list if shapes[shape_idx].left == top_label_left][0]
auto_shape_list.remove(top_label_idx)
bottom_label_idx = auto_shape_list[0]
top_table_left = min([shapes[shape_idx].left for shape_idx in table_list])
top_table_idx = [shape_idx for shape_idx in table_list if shapes[shape_idx].left == top_table_left][0]
table_list.remove(top_table_idx)
bottom_table_idx = table_list[0]
paragraph = shapes[last_update_date_idx].text_frame.paragraphs[0]
paragraph.runs[4].text = datetime_now.strftime("%#d %b %Y %H:%M")
paragraph = shapes[top_label_idx].text_frame.paragraphs[0]
paragraph.runs[0].text = top_df['Name'][0].replace('/', ' / ')
paragraph = shapes[bottom_label_idx].text_frame.paragraphs[0]
paragraph.runs[0].text = bottom_df['Name'][0].replace('/', ' / ')
top_table = shapes[top_table_idx].table
for i in range(5):
    for j in range(4):
        cell = top_table.cell(i+1, j)
        paragraph = cell.text_frame.paragraphs[0]
        run = paragraph.runs[0]
        run.text = str(top_df.iloc[i, j])
bottom_table = shapes[bottom_table_idx].table
for i in range(5):
    for j in range(4):
        cell = bottom_table.cell(i+1, j)
        paragraph = cell.text_frame.paragraphs[0]
        run = paragraph.runs[0]
        run.text = str(bottom_df.iloc[i, j])
currencies_ppt.save('New_Currencies.pptx')ppt_file_path = os.getcwd() + '\\New_Currencies.pptx'
powerpoint = win32com.client.Dispatch('Powerpoint.Application')
deck = powerpoint.Presentations.Open(ppt_file_path)
img_file_path = os.getcwd() + '\\Currencies.png'
powerpoint.ActivePresentation.Slides[0].Export(img_file_path, 'PNG')
pdf_file_path = os.getcwd() + '\\Currencies.pdf'
deck.SaveAs(pdf_file_path, 32)
deck.Close()
powerpoint.Quit()
os.system('taskkill /F /IM POWERPNT.EXE')
The code seems so long and complicated. Don’t panic. If you understand the structure, you can handle it easily.
- Specify the slide you are working on.
- Remove the existing plots.
- Add the new plots.
- Define the shape index for the components.
- Update the components one by one.
- Export the PPT into whatever format we want.
1. Load the PPT and specify the slide
currencies_ppt = Presentation('Currencies.pptx')
slide = currencies_ppt.slides[0]
From the above code, you can see the number 0 in the bracket. It refers to the slide number. Since I am working on the first slide, I specify the number to be 0. For example, if your regular update slide is in slide 10, then you have to specify the number as 9.
2. Remove the old plots
In Step 1, we have defined our 7 components and there are two plots — component 6 and component 7. To replace them, we first have to delete them. Otherwise, the new plots will be overlapped with the old plots. But the problem is ‘how do we specify the particular items in the slide?’
In python-pptx, we have different shapes for different objects. To check the shapes you now have in the slide, you can do the following code.
for shape in slide.shapes:
    print(shape.shape_type)
Take my slide as an example, the below is the output I received.
PICTURE (13)
PICTURE (13)
TEXT_BOX (17)
TABLE (19)
TABLE (19)
TEXT_BOX (17)
TEXT_BOX (17)
AUTO_SHAPE (1)
AUTO_SHAPE (1)
Then we can figure out the old plots should be PICTURE (13) . To remove them, we just need to check the shape type whether equals 13 or not.
shapes = slide.shapes
for shape in shapes:
    if shape.shape_type == 13:
        shapes.element.remove(shape.element)
3. Add the new plots
The charts can be easily added with the following function.
add_picture(image_file, left, top, width=None, height=None)
Basically, the thing you have to do is to set the image file path and the x-y location of the image you would like to put just like below.
top_img_path = 'top.png'
bottom_img_path = 'bottom.png'
top_pic = slide.shapes.add_picture(top_img_path, Inches(0.40), Inches(4.85), width=Inches(5.30))
bottom_pic = slide.shapes.add_picture(bottom_img_path, Inches(5.25), Inches(4.85), width=Inches(5.30))
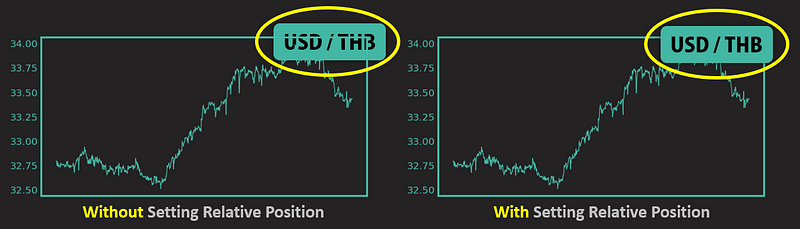
Please note that one more step to go for the figures is to specify the placing order of the images. By doing so, you have to find a relative shape as the reference shape and use the addnext and addprevious functions to specify their relationships. This is just like the concept of Bring Forward and Send Backward in PowerPoint.
ref_element = slide.shapes[0]._element
ref_element.addprevious(top_pic._element)
ref_element.addprevious(bottom_pic._element)
4. Find the shape index
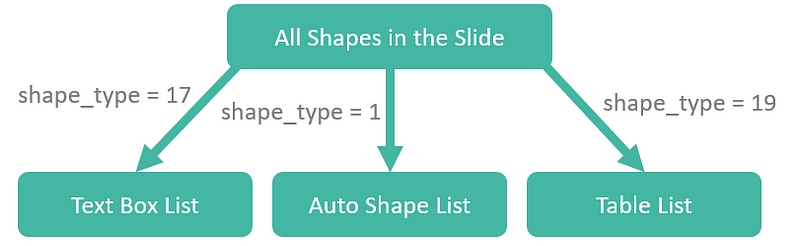
To edit the shape, we have to identify which shape index it refers to. In shorts, we would firstly categorize the shapes into different lists and identify the corresponding shape index based on the x-coordinate (left) and y-coordinate (height).
shapes = slide.shapes
text_box_list = []
auto_shape_list = []
table_list = []
for shape_idx in range(len(shapes)):
    shape = shapes[shape_idx]
    if shape.shape_type == 17:
        text_box_list.append(shape_idx)
    if shape.shape_type == 1:
        auto_shape_list.append(shape_idx)
    if shape.shape_type == 19:
        table_list.append(shape_idx)
Text Box List
There are three shapes for text boxes. To identify the last update date time shape, we can find the one with the largest height.
last_update_date_textbox_height = max([shapes[shape_idx].height for shape_idx in text_box_list])
last_update_date_idx = [shape_idx for shape_idx in text_box_list if shapes[shape_idx].height == last_update_date_textbox_height][0]
Auto Shape List
There are only two auto shapes which would be the top label and bottom label. They are having the same height but different x-coordinates. The one with the smallest value in left would be the top label and the other one would be the bottom label.
top_label_left = min([shapes[shape_idx].left for shape_idx in auto_shape_list])
top_label_idx = [shape_idx for shape_idx in auto_shape_list if shapes[shape_idx].left == top_label_left][0]
auto_shape_list.remove(top_label_idx)
bottom_label_idx = auto_shape_list[0]

Table List
Since there are also only two tables, we can simply apply a similar trick just like what we did in the auto shape list.

top_table_left = min([shapes[shape_idx].left for shape_idx in table_list])
top_table_idx = [shape_idx for shape_idx in table_list if shapes[shape_idx].left == top_table_left][0]
table_list.remove(top_table_idx)
bottom_table_idx = table_list[0]
5. Update the components
To update the components, one extremely important rule is to follow changing value inside the shape but not the formatting. In below, I use the last update date time as an example.
Plain Text (Don’t use this one)
shapes[last_update_date_idx].text = 'Last Update: ' + datetime_now.strftime("%#d %b %Y %H:%M")Text with Formatting (Use this one)
paragraph = shapes[last_update_date_idx].text_frame.paragraphs[0]
paragraph.runs[4].text = datetime_now.strftime("%#d %b %Y %H:%M")

From the above image, you can tell difference. A paragraph is actually used to store not only the value of the shape but also the formatting information such as the alignment, font, hyperlink and etc. Therefore, remember to change the text value in the paragraph runs but not the shape one.
The labels of the figures are actually having the same structure and I am going to repeat the concept again. Let’s move to the update for the table value.
top_table = shapes[top_table_idx].table
for i in range(5):
    for j in range(4):
        cell = top_table.cell(i+1, j)
        paragraph = cell.text_frame.paragraphs[0]
        run = paragraph.runs[0]
        run.text = str(top_df.iloc[i, j])
Basically, it’s pretty straightforward. We find our interested table and change the value inside the paragraph runs for each cell in the table. Please note that i refers to the row record and j refers to the column.
6. Export the files
The tutorial is almost done and the last step would be to transform the file into the format we want. Basically, let me share the most common file structures people would use.
Save as PPT
currencies_ppt.save('New_Currencies.pptx')Save as PNG
import win32com.client
import os
ppt_file_path = os.getcwd() + '\\New_Currencies.pptx'
powerpoint = win32com.client.Dispatch('Powerpoint.Application')
deck = powerpoint.Presentations.Open(ppt_file_path)
img_file_path = os.getcwd() + '\\Currencies.png'
powerpoint.ActivePresentation.Slides[0].Export(img_file_path, 'PNG')
deck.Close()
powerpoint.Quit()
os.system('taskkill /F /IM POWERPNT.EXE')
Save as PDF
import win32com.client
import os
ppt_file_path = os.getcwd() + '\\New_Currencies.pptx'
powerpoint = win32com.client.Dispatch('Powerpoint.Application')
deck = powerpoint.Presentations.Open(ppt_file_path)
pdf_file_path = os.getcwd() + '\\Currencies.pdf'
deck.SaveAs(pdf_file_path, 32)
deck.Close()
powerpoint.Quit()
os.system('taskkill /F /IM POWERPNT.EXE')
Conclusion
That’s the end of the office tips for using Python to automate the work in PowerPoint. If you are interested to know more about this kind of work tips, do give a like and follow. Stay tuned for my next tutorial. =)
If you find my article useful, please endorse my skills on my LinkedIn page to encourage me to write more articles.
Comments
Post a Comment