
Bill Benter (1994) Computer Based Horse Race Handicapping and Wagering Systems: A Report
A summarised article to let you have a basic understanding of parimutuel handicapping model

Summary
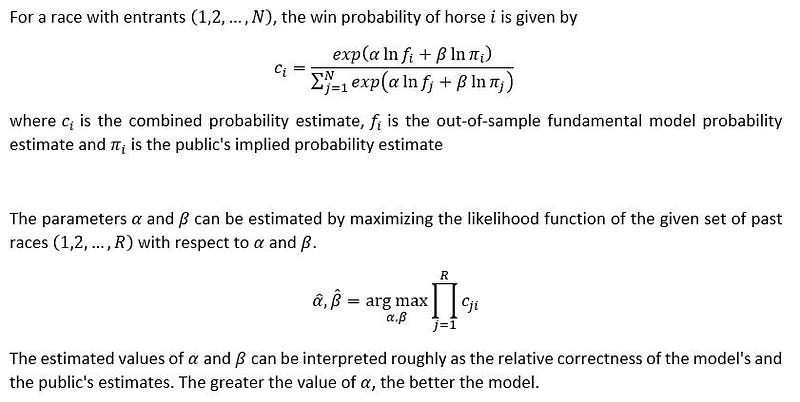
This paper examines the elements necessary for a practical and successful computerized horse race handicapping and wagering system. Data requirements, handicapping model development, wagering strategy, and feasibility are addressed. A logit-based technique and a corresponding heuristic measure of improvement are described for combining a fundamental handicapping model with the public’s implied probability estimates. The author reports significant positive results in five years of the actual implementation of such a system. This result can be interpreted as evidence of inefficiency in pari-mutuel racetrack wagering. This paper aims to emphasize those aspects of computer handicapping which the author has found most important in the practical application of such a system.
Motivation
Certain authors are concerned mainly with the public odds and do not attempt to predict horse performance from fundamental factors.
- Dr. Z’s Beat the Racetrack (Ziemba, William T. and Donald B. Hausch, 1987)
- Betting at the Racetrack (Ziemba, William T. and Donald B. Hausch, 1986)
- Racetrack Betting: The Professors’ Guide to Strategies, (Asch, P., RE. Quandt, 1986)
Although this requires relatively little preparatory effort and can be effectively employed by the occasional racegoer, the betting opportunities tend to occur infrequently and the maximum expected profit achievable is usually relatively modest. Therefore, Bill Benter decided to develop a computer model to estimate each horse’s probability of winning and calculate the appropriate amount to wager.
Advantages of Computer Approach Handicapping
- Due to empirical nature, one need not possess specific handicapping expertise to undertake this enterprise, as everything one needs to know can be learned from the data.
- The testability of a computer system is unquestionable. One can develop a model and test it on unseen races and obtain a reasonable estimate of the system’s real-time performance before wagering any actual money.
- The consistency of a computer system regardless of the mental state of the operator. This is a non-trivial advantage considering that a professional level betting operation may want to bet several races a day for extended periods.
Features Engineering
Bill Benter classified various types of factors into five groups.
- Current Condition- Performance in recent races
- Time since last race
- Recent workout data
- Age of horse - Past Performance- Finishing position in past races
- Lengths behind the winner in past races
- Normalized times of past races - Adjustments to Past Performance- Strength of competition in past races
- Weight carried in past races
- Jockey’s contribution to past performances
- Compensation for bad luck in past races
- Compensation for advantageous or disadvantageous post position in past races - Present Race Situational Factors- Weight to be carried
- Today’s jockey’s ability
- Advantages or disadvantages of the assigned post position - Preferences which could Influence the Horse’s Performance in Today’s Race- Distance preference
- Surface preference (Turf vs Dirt)
- Condition of surface preference (Wet vs Dry)
- Specific track preference
Race Data Required
Bill Benter suggested the minimum amount of data needed for adequate model development and testing samples is in the range of 500 to l000 races since out-of-sample predictive accuracy does not seem to improve dramatically with development samples greater than 1000 races.
Features Selection
It is important to define factors that extract as much information as possible out of the data in each of the relevant areas. By considering the following three different specifications of a ‘distance preference’ factor:
- NEWDIST (Bolton and Chapman, 1986)
This variable equals one if a horse has run three of its four previous races at a distance less than a mile, zero otherwise. - DOK (Brecher, 1980)
This variable equals one if the horse finished in the upper 50th percentile or within 6.25 lengths of the winner in a prior race within 1/16 of a mile of today’s distance, or zero otherwise. - DP6A (Bill Benter’s Model)
For each of a horse’s past races, a predicted finishing position is calculated via multiple regression based on all factors except those relating to distance. This predicted finishing position in each race is then subtracted from the horse’s actual finishing position. The final magnitude of the estimate is standardized by dividing it by its standard error.
The best is the one that produces the greatest increase in predictive accuracy when included in the model.
The general thrust of model development is to continually experiment with refinements of the various factors.
Statistical Testing on Variables
Ideally, each independent variable would capture a unique aspect of the influences affecting horse performance. The trial and error method of adding independent variables to increase the model’s goodness-of-fit results in the model tending to become a hodgepodge of highly correlated variables whose individual significances are difficult to determine and often counter-intuitive. For example, “Number of Past Races” is one of the more significant factors in the handicapping model and contributes greatly to the overall accuracy of the predictions although there is no common sense reason why this factor should be important.
Insiders’ Betting Reflects in Odds
There will always be a significant amount of inside information in horse racing that cannot be readily included in a statistical model. Trainer’s and jockey’s intentions, secret workouts, whether the horse ate its breakfast, and the like, will be available to certain parties who will no doubt take advantage of it. Their betting will be reflected in the odds.
Therefore, it is needed to find a way of combining the judgments of two experts — the fundamental model and the public.
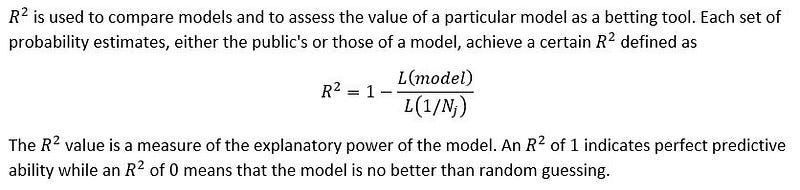
Model Evaluation
Wagering Strategy
Kelly betting strategy balances the tradeoff between risk and returns. The Kelly strategy specifies the fraction of total wealth to wager so as to maximize the exponential rate of growth of wealth, in situations where the advantage and payoff odds are known. For a single bet,

In Bill Benter’s experience, betting the full amount recommended by the Kelly formula is unwise for the following reasons.
- Accurate estimation of the advantage of the bets is critical. If one overestimates the advantage by more than a factor of two, Kelly betting will cause a negative rate of capital growth.
- If it is known that regular withdrawals from the betting bankroll will be made for paying expenses or taking profits, then one’s effective wealth is less than their actual current wealth.
- Full Kelly betting is a ‘rough ride’, downswings during which more than 50% of total wealth is lost are a common occurrence.
Therefore, a fractional Kelly betting strategy is advisable, that is, a strategy wherein one bets some fraction of the recommended Kelly bet (e.g. 1/2 or 1/3).
Advanced Wagering Strategy
However, multiple bets are available in each race, and each bet affects the final payoff odds, the exact solution requires maximizing a concave logarithmic function of several variables. For further discussion, please see
Growth Versus Security in Dynamic Investment Analysis (MacLean, LC., W.T. Ziemba and G. Blazenko, 1992)
Another constraint on betting is the effect that one’s bet has on the advantage. In pari-mutuel betting markets, each bet decreases the dividend. Even if the bettor possesses infinite wealth, there is a maximum bet producing the greatest expected profit, any amount beyond lowers the expected profit. A further consideration concerns the shape of the ‘expected profit versus bet size’ curve when the bet size is approaching the maximum.
Pari-mutuel Betting Models (Kallberg, J.G. and W.T. Ziemba, 1994)
Exotic Betting
Bill Benter indicated that the Harville formula used to specify the probability that the horses will finish in order was significantly biased and should not be used for betting purposes as it will lead to serious errors in estimations.
Therefore, Bill Benter developed an effective and computationally economical way to correct for the bias.
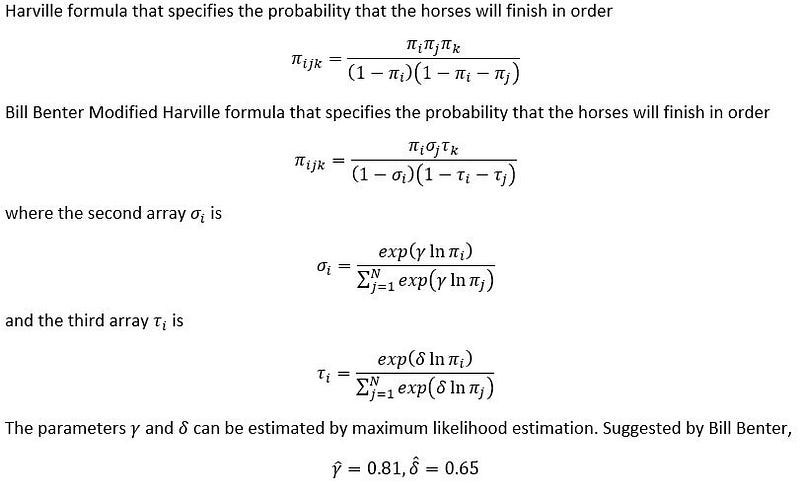
The parameter values used should NOT be considered to be universal constants as different racetrack would have significantly different values for the parameters.
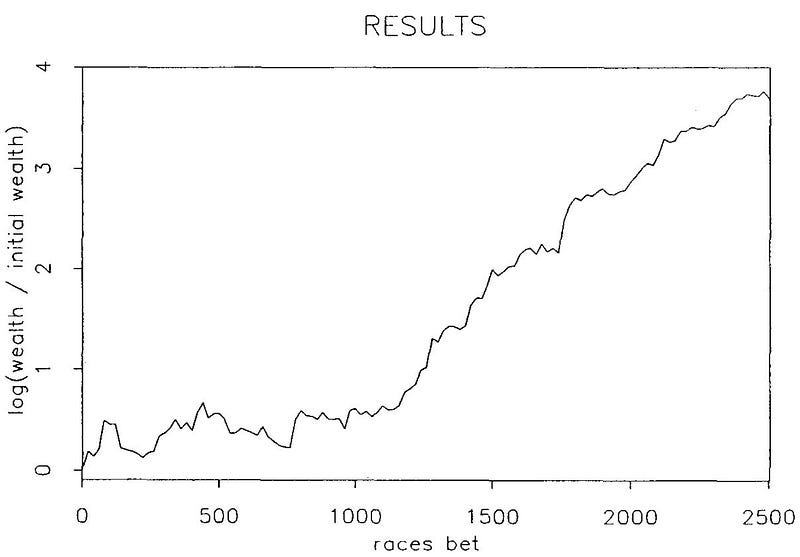
Results
Bill Benter resulted in net profits for four out of five seasons and the loss incurred during the losing season was around 20% of starting capital.
- Bill Benter used five man-years of effort to organize the database and develop a handicapping model that showed a significant advantage and another additional five man-years were necessary to develop the operation to a high level of profitability.
- A sample of approximately 2000 races was initially used for model development and testing.
- A conservative fractional Kelly betting strategy was employed throughout, with wagers being placed on all positive expectation bets available in both normal and exotic pools except place and show bets.
- Extremely large pool sizes ( > USD $10,000,000 per race turnover ) made for low volatility odds, therefore bets could be placed with accurate estimations of the final public odds.
- Bets were made on all available races except for 5% races containing only unratable horses, resulting in approximately 470 races bet per year. The average track take was around 19% during this period.
Comments
Post a Comment